Visualizations
The following links provide dynamic visualizations of selected land parameter retrievals from the AMSR-E sensor operating on-board NASA’s EOS Aqua satellite since 2002. Complete animation files (mp4 format) are located in the UMT FT-ESDR directory. Selected animations formatted for an OmniGlobe spherical display system are also available in the UMT FT-ESDR OmniGlobe directory. These parameters are derived from satellite observed microwave brightness temperatures over land using retrieval algorithms developed at the University of Montana. AMSR-E observes the Earth at microwave frequencies that are largely insensitive to solar illumination, clouds, smoke & other atmosphere effects, enabling continuous near-daily global observations of dynamic land surface processes. The satellite retrievals include landscape freeze/thaw status, air temperature, open water inundation, vegetation optical depth & surface soil moisture parameters. Together these visualizations capture the dynamic Earth, & the spatial patterns & seasonal to annual variability of surface temperature, moisture & vegetation processes.
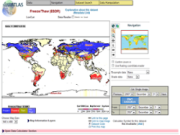
Monthly mean minimum daily air temperature & frozen period
Land surface (~2m height) minimum daily air temperatures were derived from daily (1:30 AM equatorial overpass) multi-frequency brightness temperature (Tb) measurements from AMSR-E. The animation (at right) also shows the estimated monthly frozen period (days) derived using a temporal change classification of daily Tb (36V GHz) series to determine landscape freeze/thaw (FT) status. The FT retrievals are used as a prerequisite frozen area flag for obtaining air temperature retrievals under classified non-frozen conditions. Data retrieval gaps due to missing or screened Tb observations are shown in white. The animation shows the characteristic global seasonality of frozen conditions & air temperatures ranging from maximum warming in summer to seasonal minimum temperatures & widespread frozen conditions in winter. The fall & winter periods coincide with an expansion of cooling & frozen area from the poles to lower latitudes & from high to low elevations, & a return to warmer conditions & poleward retreat of frozen conditions in spring & summer.
Video
Monthly mean maximum daily air temperature & frozen period
The land surface (~2m height) maximum daily air temperature retrievals were derived from daily multi-frequency Tb measurements. The animation (right) also shows the estimated monthly frozen period derived using a temporal change classification of daily Tb (36V GHz) series to determine landscape FT status used as a frozen area flag for obtaining air temperature retrievals under classified non-frozen conditions. These results are similar to the above temperature animations, except that the maximum daily air temperature retrievals are derived from sensor PM (1:30 PM equatorial crossing) Tb overpass observations. AMSR-E provides approximately global, twice daily (ascending & descending orbit) observations enabling retrievals of diurnal air temperature changes. Data gaps due to missing or screened Tb observations are shown in white.
Video
monthly mean daily vegetation canopy optical depth & frozen period
Video
Monthly mean fractional open water inundation
Mean monthly fractional open water (Fw) inundation derived from AMSR-E 18.7 & 23.8 GHz Tb records. The Tb data are strongly sensitive to land surface wetness, while the Fw parameter quantifies the proportional (%) coverage of open water inundation within each ~25-km grid cell. The Fw animation (right) shows the characteristic large seasonal inundation variation for many wetlands (e.g. Amazon, tropical monsoon & northern tundra) & other prominant Fw areas including large river floodplains (e.g. Mississippi, Amazon, Ganges, Yangtze). These results also provide a metric of dynamic surface water storage changes over the globe. The animation also shows the estimated monthly frozen period derived through temporal FT classification of daily Tb (36V GHz) series, & used as a flag for obtaining Fw & other land parameter retrievals under classified non-frozen conditions.
Video
Monthly mean surface soil moisture & frozen period
Land surface monthly mean daily soil moisture (% volumetric) retrievals derived from AMSR-E daily (AM & PM overpass) multi-frequency Tb measurements. The animation (right) also shows the estimated monthly frozen period (days) derived from FT classification of daily Tb (36V GHz) series and used as a flag for obtaining soil moisture retrievals under classified non-frozen conditions. The soil moisture retrievals are derived from X/C-band (10.7/6.9 GHz) Tb data & reflect surface (~1-2 cm depth) soil conditions under relatively low vegetation biomass cover. The soil moisture conditions are obscured under dense vegetation (in green) indicated by the VOD retrievals above. These results show the characteristic N-S seasonal changes in frozen period, as well as dynamic soil moisture changes in response to wetting & drying events. Dynamic spatial/temporal variability in the dense vegetation (VOD) areas reflect vegetation phenology cycles of seasonal canopy biomass growth & senescence, which influence the corresponding soil moisture retrievals. Other retrieval gaps due to missing or screened Tb observations are shown in white. Similar products are planned for the NASA Soil Moisture Active Passive (SMAP) mission (mid-2014 launch), which will provide enhanced (L-band) sensitivity to soil moisture & freeze/thaw processes.