
MODIS GPP/NPP Project (MOD17)
Project Summary
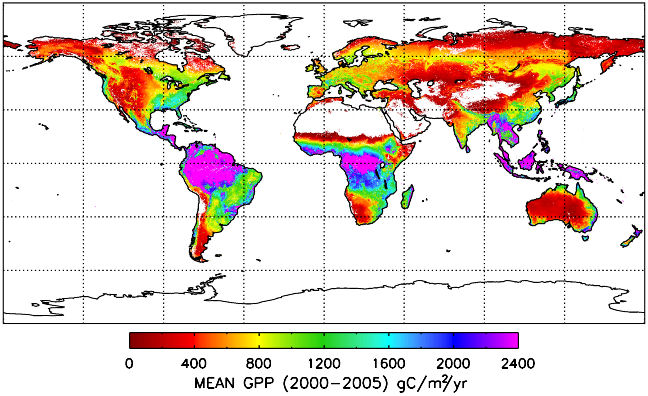
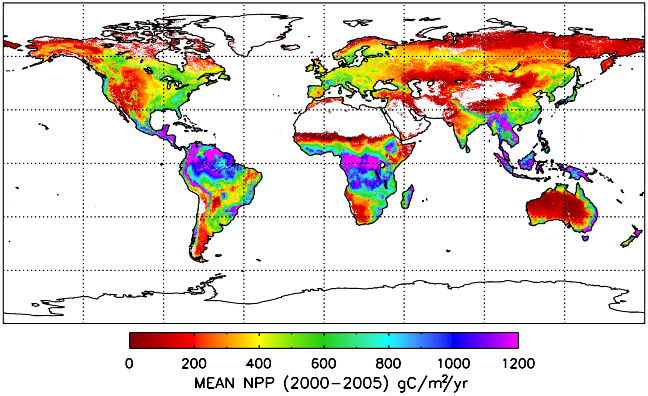
The goal of the MOD17 MODIS project is to provide continuous estimates of Gross/Net Primary Production (GPP/NPP) across Earth’s entire vegetated land surface. MOD17 GPP/NPP outputs are useful for natural resource and land management, global carbon cycle analysis, ecosystem status assessment, and environmental change monitoring. MOD17 is part of the NASA Earth Observation System (EOS) program and is the first satellite-driven dataset to monitor vegetation productivity on a global scale.
MOD17 Algorithm Description
The MOD17 algorithm is based on the original radiation use efficiency logic of Monteith (1972), which suggests that productivity of annual crops under well-watered and fertilized conditions is linearly related to the amount of absorbed solar energy—specifically, the amount of absorbed Photosynthetically Active Radiation (APAR). The translation of APAR to an actual productivity estimate is conducted via a conversion efficiency parameter, ε, which varies by vegetation type and climate conditions. In consequence, MOD17 incorporates differences in maximum ε among vegetation types and also lowers ε under water-stressed and/or cold temperature conditions. To calculate NPP, MOD17 also estimates daily leaf and fine root maintenance respiration (R_lr), annual growth respiration (R_g), and annual maintenance respiration of live cells in woody tissue (R_m).
The main MOD17 data outputs include:
- 8-day GPP (GPP = ε_max * Temperature_Scalar * Water_Stress_Scalar * APAR)
- 8-day Net Photosynthesis (PSNet = GPP - R_lr)
- Annual NPP (NPP = PSNet_Sum - R_g - R_m)
A more detailed overview of the MOD17 algorithm can be found in the MOD17 User’s Guide, Running et al. (2004), Zhao et al. (2005) and in the scientific publications listed under the publications below.
Main Data Inputs
To estimate GPP/NPP, the main data inputs to the MOD17 algorithm include:
- Fraction of Photosynthetically Active Radiation (FPAR) and Leaf Area Index (LAI) from the MODIS MOD15 LAI/FPAR data product
- Temperature, incoming solar radiation, and vapor pressure deficit derived from a meteorology dataset. Meteorology datasets used by various versions of the MOD17 algorithm include products from the NASA Global Modeling and Assimilation Office and the NCEP/NCAR Reanalysis II
- Land cover classification from the MODIS MCD12Q1 data product
- A Biome Parameter Lookup Table (BPLUT) containing values of ε_max for different vegetation types and other biome-specific physiological parameters for respiration calculations. The different vegetation types (obtained from the land cover type 2 classification) include: evergreen needleleaf forest, evergreen broadleaf forest, deciduous needleleaf forest, deciduous broadleaf forest, mixed forests, closed shrublands, open shrublands, woody savannas, savannas, grasslands, and croplands.
Key Datasets
The MOD17 dataset (version 55) Available from 2000 – 2012 at 8-day, monthly, and annual time steps. Updates are provided on an annual basis. Compared to the NASA/USGS LPDAAC 8-day and annual v5 product, NTSG MOD17 v55 contains the following main improvements:
- Temporal infilling of cloud-contaminated pixels
- A consistent forcing meteorology (NCEP/NCAR Reanalysis II)
Details of version 55 improvements can be found in Zhao et al. (2005), Zhao et al. (2006), and in the supplemental material of Zhao and Running (2010).
Images
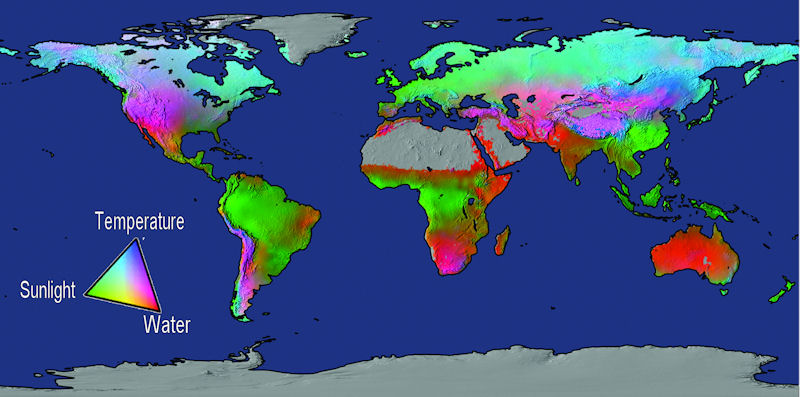
Figure 1. Potential limits to vegetation net primary production based on fundamental physiological limits by solar radiation, water balance, and temperature (from Churkina & Running, 1998; Nemani et al., 2003; Running et al., 2004).
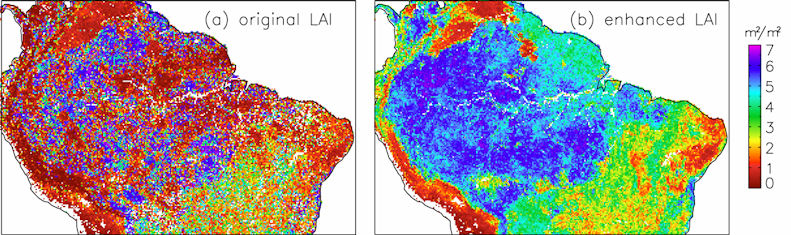
Figure 2. The 8-day composite leaf area index (LAI) in Amazon region for the 8-day period 081 (March 21–28) in 2001 for (a) the original with no temporal interpolation of the LAI and (b) the temporally interpolated LAI. (Mu et al., 2007 Remote Sensing of Environment, in press; Zhao et al., 2005)
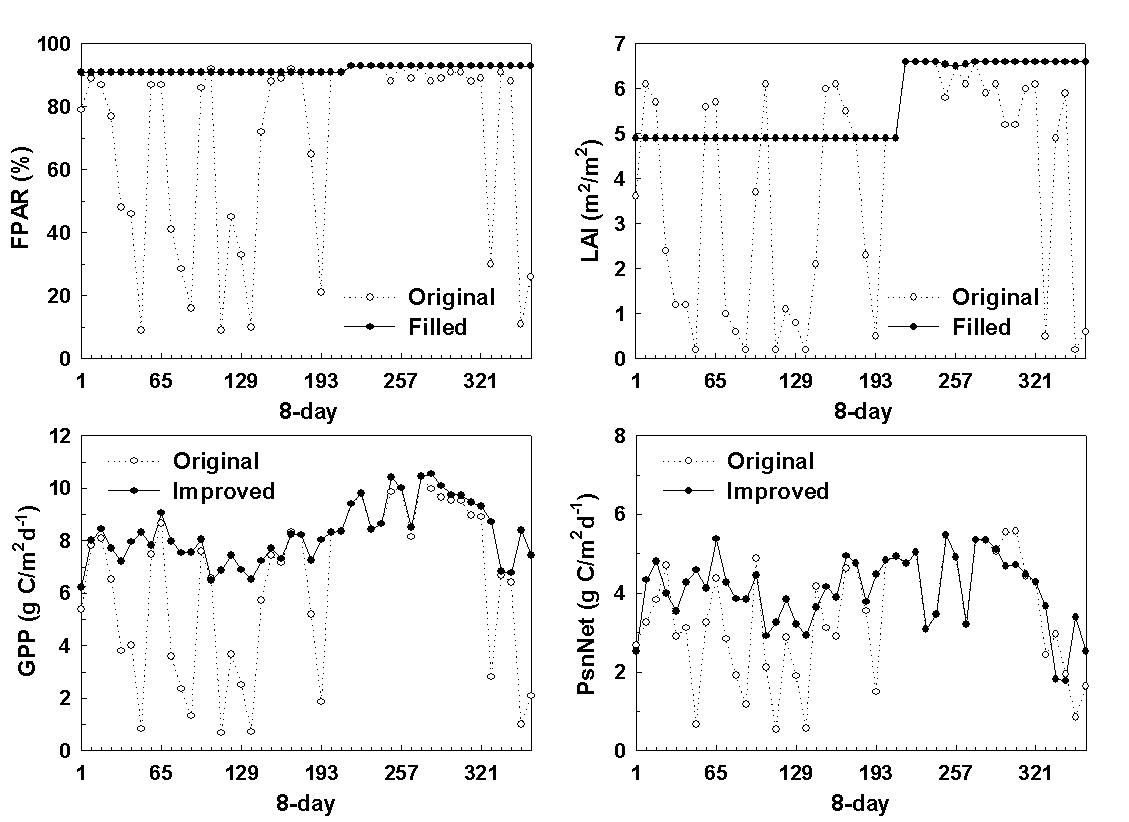
Figure 3. An example on how temporal filling unreliable 8-day Collection 4 FPAR/LAI, and therefore improved 8-day GPP and PsnNet for one MODIS 1-km pixel located in Amazon basin (lat = -5.0, lon = -65.0) (from Zhao et al., 2005)
Validation with GPP estimated at eddy flow towers
Interannual variability at the global scale and over the North American Carbon Program (NACP) domain

Selected Publications
Tidal Wetland Gross Primary Production Across the Continental United States
Citation
Feagin R, Forbrich I, Huff T, Barr J, Ruiz-Plancarte J, Fuentes J, Najjar R, Vargas R, Vazquez-Lule A, Windham-Myers L, Kroeger K, Ward E, Moore G, Leclerc M, Krauss K, Stagg C, Alber M, Knox S, Schafer K, Bianchi T, Hutchings J, Nahrawi H, Noormets A, Mitra B, Jaimes A, Hinson A, Bergamaschi B, King J, Miao G. Tidal Wetland Gross Primary Production Across the Continental United States, 2000-2019. Global Biogeochemical Cycles. 2020. 34(2). https://doi.org/10.1029/2019GB006349.
Abstract
We mapped tidal wetland gross primary production (GPP) with unprecedented detail for multiple wetland types across the continental United States (CONUS) at 16‐day intervals for the years 2000–2019. To accomplish this task, we developed the spatially explicit Blue Carbon (BC) model, which combined tidal wetland cover and field‐based eddy covariance tower data into a single Bayesian framework, and used a super computer network and remote sensing imagery (Moderate Resolution Imaging Spectroradiometer Enhanced Vegetation Index). We found a strong fit between the BC model and eddy covariance data from 10 different towers (r2 = 0.83, p < 0.001, root‐mean‐square error = 1.22 g C/m2/day, average error was 7% with a mean bias of nearly zero). When compared with NASA's MOD17 GPP product, which uses a generalized terrestrial algorithm, the BC model reduced error by approximately half (MOD17 had r2 = 0.45, p < 0.001, root‐mean‐square error of 3.38 g C/m2/day, average error of 15%). The BC model also included mixed pixels in areas not covered by MOD17, which comprised approximately 16.8% of CONUS tidal wetland GPP. Results showed that across CONUS between 2000 and 2019, the average daily GPP per m2 was 4.32 ± 2.45 g C/m2/day. The total annual GPP for the CONUS was 39.65 ± 0.89 Tg C/year. GPP for the Gulf Coast was nearly double that of the Atlantic and Pacific Coasts combined. Louisiana alone accounted for 15.78 ± 0.75 Tg C/year, with its Atchafalaya/Vermillion Bay basin at 4.72 ± 0.14 Tg C/year. The BC model provides a robust platform for integrating data from disparate sources and exploring regional trends in GPP across tidal wetlands.
Integrating a PhenoCam-derived vegetation index into a light use efficiency model to estimate daily gross primary production in a semi-arid grassland.
Citation
Hesong W, Gensuo J, Epstein H, Huichen Z, Anzhi Z. Integrating a PhenoCam-derived vegetation index into a light use efficiency model to estimate daily gross primary production in a semi-arid grassland. Agricultural and Forest Meteorology. 2020. 288-289. https://doi.org/10.1016/j.agrformet.2020.107983
Abstract
The accurate estimation of temporally-continuous gross primary production (GPP) is important for a mechanistic understanding of the global carbon budget, as well as the carbon exchange between land and atmosphere. Ground-based PhenoCams can provide near-surface observations of plant phenology with high temporal resolution and possess great potential for use in modeling the seasonal dynamics of GPP. However, due to the site-level empirical approaches for estimating the fraction of absorbed photosynthetically active radiation (fAPAR), a broad application of PhenoCams in GPP modeling has been restricted. In this study, the stage of vegetation phenology (Pscalar) is proposed, which is calculated from the excess green index (ExGI) derived from PhenoCam data. We integrate Pscalar with the enhanced vegetation index (EVI) derived from the Moderate Resolution Imaging Spectroradiometer (MODIS) in order to generate a daily time-series of the fAPAR (fAPARCAM), and then to estimate daily GPP (GPPCAM) with a light use efficiency model in a semi-arid grassland area from 2012 to 2014. Over the three continuous years, the daily fAPARCAM exhibited similar temporal behavior to the eddy covariance–measured GPP (GPPEC), and the overall determination coefficients (R2) were all > 0.81. GPPCAM agreed well with GPPEC, and these agreements were highly statistically significant (p < 0.01); R2 varied from 0.80 to 0.87, the relative error (RE) varied from -2.9% to 2.81%, and the root mean square error (RMSE) ranged from 0.83 to 0.98 gC/m2/d. GPPCAM was then resampled to 8-day temporal resolution (GPPCAM8d), and further evaluated by comparisons with MODIS GPP products (GPPMOD17) and vegetation photosynthesis model (VPM)–derived GPP (GPPVPM). Validation revealed that the variance explained by GPPCAM8d was still the greatest among these three GPP products. The RMSE and RE of GPPCAM8d were also lower than those of the other two GPP products. The explanatory power of predictors in GPP modeling was also explored; the fAPAR was found to be the most influential predictor, followed by photosynthetically active radiation (PAR). The contributions of the environmental stress indices of temperature and water (Tscalar and Wscalar, respectively) were less than that of PAR. These results highlight the potential for PhenoCam images in high temporal resolution GPP modeling. Our GPP modeling method will help reduce uncertainties by using PhenoCam images for monitoring the seasonal development of vegetation production.
Assimilation of Earth Observation Data Over Cropland and Grassland Sites into a Simple GPP Model.
Citation
Meroni M, Fasbender D, Lopez-Lozano R, Migliavacca M. Assimilation of Earth Observation Data Over Cropland and Grassland Sites into a Simple GPP Model. Remote Sensing. 749(11). https://doi.org/10.3390/rs11070749.
Abstract
The application of detailed process-oriented simulation models for gross primary production (GPP) estimation is constrained by the scarcity of the data needed for their parametrization. In this manuscript, we present the development and test of the assimilation of Moderate Resolution Imaging Spectroradiometer (MODIS) satellite Normalized Difference Vegetation Index (NDVI) observations into a simple process-based model driven by basic meteorological variables (i.e., global radiation, temperature, precipitation and reference evapotranspiration, all from global circulation models of the European Centre for Medium-Range Weather Forecasts). The model is run at daily time-step using meteorological forcing and provides estimates of GPP and LAI, the latter used to simulate MODIS NDVI though the coupling with the radiative transfer model PROSAIL5B. Modelled GPP is compared with the remote sensing-driven MODIS GPP product (MOD17) and the quality of both estimates are assessed against GPP from European eddy covariance flux sites over crops and grasslands. Model performances in GPP estimation (R2 = 0.67, RMSE = 2.45 gC m−2 d−1, MBE = −0.16 gC m−2 d−1) were shown to outperform those of MOD17 for the investigated sites (R2 = 0.53, RMSE = 3.15 gC m−2 d−1, MBE = −1.08 gC m−2 d−1).
Assessments of gross primary productivity estimations with satellite data-driven models using eddy covariance observation sites over the northern hemisphere.
Citation
Xie X, Li A, Tan J, Jin H, Nan X, Zhang Z, Bian J, Lei G. Assessments of gross primary productivity estimations with satellite data-driven models using eddy covariance observation sites over the northern hemisphere. Agricultural and Forest Meteorology. 2020. 280. https://doi.org/10.1016/j.agrformet.2019.107771.
Abstract
The accurate quantification of gross primary productivity (GPP) has been a major challenge in global climate change research. Satellite data-driven models have been universally used as scientific tools for investigating the carbon cycle, including vegetation index (VI)-based models, light use efficiency (LUE) models, and process-based models. However, inconsistencies and uncertainties have been found in the GPP estimations from various models. The understanding of model behaviors under different climatic conditions remains unclear. In this study, three typical satellite data-driven models, namely, Moderate Resolution Imaging Spectroradiometer (MODIS) GPP (MOD17) model, Temperature and Greenness (TG) model and Boreal Ecosystem Productivity Simulator (BEPS), respectively, were compared to better understand discrepancies and uncertainties in GPP estimations at 119 northern eddy covariance (EC) sites. Due to the variations in climatic drivers of GPP, temperature, precipitation and incoming solar radiation were selected to describe climatic conditions. The results showed that BEPS and MOD17 exhibited similar performance in simulating GPP, with root-mean-square error (RMSE) values of 2.50 g C m−2 d−1 and 2.53 g C m−2 d−1, respectively, and performed slightly better than TG (RMSE = 2.98 g C m−2 d−1). Comparison between simulated GPP and EC GPP also revealed that model performance varied substantially among different vegetation types. The three models performed better for deciduous broadleaf forest, evergreen needleleaf forest, and mixed forest, in comparison to the results from evergreen broadleaf forest and crop. Specifically, all three models showed poor performance be constant in the LUE modelunder the conditions of high temperature and low precipitation, revealing the models’ inability to characterize the impact of water stress on photosynthesis when drought occurs. Furthermore, our results indicated that GPP estimations from satellite data-driven models were also sensitive to remotely sensed data, suggesting that the high accuracy of remotely sensed data in describing vegetation canopy is important for carbon modeling. This study highlights the importance of understanding model behaviors in different vegetation types and climatic conditions, so that the model performances may be improved in future carbon cycle studies.
Improving satellite-based modelling of gross primary production in deciduous broadleaf forests by accounting for seasonality in light use efficiency.
Citation
Zhou X, Xin Q. Improving satellite-based modelling of gross primary production in deciduous broadleaf forests by accounting for seasonality in light use efficiency. International Journal of Remote Sensing. 2019. 40(3). https://doi.org/10.1080/01431161.2018.1519285.
Abstract
Vegetation gross primary production (GPP), the photosynthetic yields by green plants per unit area per unit time, is a key metric of carbon flux in understanding the land–atmosphere interactions and terrestrial carbon cycles. Satellite-based light use efficiency (LUE) models are valuable methods to retrieve large-scale terrestrial GPP using remote sensing data. As studies have reported that maximum light use efficiency, a key parameter that is often assumed to be constant in the LUE models, there is a need to explore the effects of LUE seasonality on GPP simulation and ways for correction. This study proposes a method based on leaf area index to account for LUE seasonality and applies it to four different light use efficiency models (i.e., the MOD17 algorithm, the vegetation photosynthesis model, the radiation partitioning model, and the vegetation index model) for comparisons. Based on 59 site-years flux tower data from deciduous broadleaf forest sites in the United States, the results show that all models could simulate daily GPP time series well and explain more than 85.0% variance of tower-based GPP. There is, however, a tendency to overestimate GPP during the non-growing season but underestimate GPP during the growing season. By applying the correction function, GPP simulation using the LUE models improved in all experiments as indicated by increased correlation coefficients, the index of agreement and decreased root-mean-square errors. Among all models, the radiation partitioning model achieves the highest correlation coefficients between modelled and observed daily GPP likely because it considers the influences of direct and diffuse radiation partitioning on daily canopy photosynthesis. Our study indicates that satellite-based light use efficiency models could be successfully applied for deriving daily vegetation GPP and potentially producing daily routine satellite products, while considering the effects of LUE seasonality on canopy could help improve significantly the simulation accuracy of daily GPP in phenology.
Application of the MODIS MOD17 net primary production product in grassland carrying capacity assessment.
Citation
Jan de Leeuw, Afag Rizayeva, Elmaddin Namazov, Emil Bayramov, Michael T. Marshall, Jonathan Etzold, and Regina Neudert, 2019. Application of the MODIS MOD17 net primary production product in grassland carrying capacity assessment. International Journal of Applied Earth Observation and Geoinformation, 78, 66-76, https://doi.org/10.1016/j.jag.2018.09.014.
Abstract
Remote sensing based grassland carrying capacity assessments are not commonly applied in rangeland management. Possible reasons for this include non-equilibrium thinking in rangeland management, and the costliness of existing remotely sensed biomass estimation that carrying capacity assessments require. Here, we present a less demanding approach for grassland biomass estimation using the MODIS Net Primary Production (NPP) product and demonstrate its use in carrying capacity assessment over the mountain grasslands of Azerbaijan. Based on publicly available estimates of the fraction of total NPP partitioned to aboveground NPP (fANPP) we calculate the aboveground biomass produced from 2005 to 2014. Validation of the predicted aboveground biomass with independent field biomass data collected in 2007 and 2008 confirmed the accuracy of the aboveground biomass product and hence we considered it appropriate for further use in the carrying capacity assessment. A first assessment approach, which allowed for consumption of 65% of aboveground biomass, resulted in an average carrying capacity of 12.6 sheep per ha. A second more realistic approach, which further restricted grazing on slopes steeper than 10%, resulted in a stocking density of 6.20 sheep per ha and a carrying capacity of 3.93 million sheep. Our analysis reveals overgrazing of the mountain grasslands because the current livestock population which consists of at least 8 million sheep, 0.5 million goats and an unknown number of cattle exceeds the predicted carrying capacity of 3.93 million sheep. We consider that the geographically explicit advice on sustainable stocking densities is particularly attractive to regulate grazing intensity in geographically varied terrain such as the mountain grasslands of Azerbaijan. We further conclude that the approach, given its generic nature and the free availability of most input data, could be replicated elsewhere. Hence, we advise considering its use where traditional carrying capacity assessments are difficult to implement.
Response to Comments on "Drought-Induced Reduction in Global Terrestrial Net Primary Production from 2000 Through 2009"
Zhao, M. and S. W. Running
Science. 333: 1093, 2011
Samanta et al. and Medlyn challenge our report of reduced global terrestrial net primary production (NPP) from 2000 through 2009. Our new tests show that other vegetation indices had even stronger negative changes through the decade, and weakening temperature controls on water stress and respiration still did not produce a positive trend in NPP. These analyses strengthen the conclusion of drought-induced reduction in global NPP over the past decade.
Drought-induced reduction in global terrestrial net primary production from 2000 through 2009
Zhao, M. and S. W. Running
Science. 329: 940-943. 2010
Terrestrial net primary production (NPP) quantifies the amount of atmospheric carbon fixed by plants and accumulated as biomass. Previous studies have shown that climate constraints were relaxing with increasing temperature and solar radiation, allowing an upward trend in NPP from 1982 through 1999. The past decade (2000 to 2009) has been the warmest since instrumental measurements began, which could imply continued increases in NPP; however, our estimates suggest a reduction in the global NPP of 0.55 petagrams of carbon. Large-scale droughts have reduced regional NPP, and a drying trend in the Southern Hemisphere has decreased NPP in that area, counteracting the increased NPP over the Northern Hemisphere. A continued decline in NPP would not only weaken the terrestrial carbon sink, but it would also intensify future competition between food demand and proposed biofuel production.
Improvements of the MODIS terrestrial gross and net primary production global data set
Zhao, M., F. A. Heinsch, R. R. Nemani, and S. W. Running
Remote Sensing of Environment. 95: 164–176. 2005
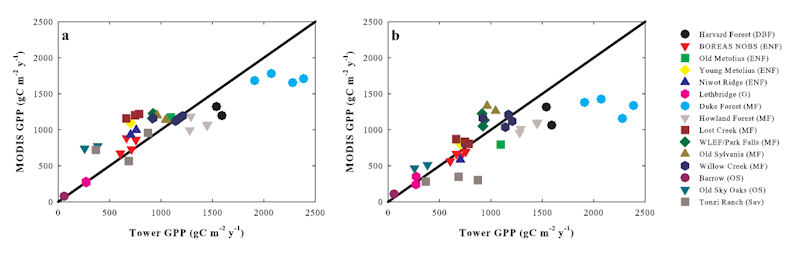
MODIS primary production products (MOD17) are the first regular, near-real-time data sets for repeated monitoring of vegetation primary production on vegetated land at 1-km resolution at an 8-day interval. But both the inconsistent spatial resolution between the gridded meteorological data and MODIS pixels, and the cloud-contaminated MODIS FPAR/LAI (MOD15A2) retrievals can introduce considerable errors to Collection4 primary production (denoted as C4 MOD17) results. Here, we aim to rectify these problems through reprocessing key inputs to MODIS primary vegetation productivity algorithm, resulting in improved Collection5 MOD17 (here denoted as C5 MOD17) estimates. This was accomplished by spatial interpolation of the coarse resolution meteorological data input and with temporal filling of cloud-contaminated MOD15A2 data. Furthermore, we modified the Biome Parameter Look-Up Table (BPLUT) based on recent synthesized NPP data and some observed GPP derived from some flux tower measurements to keep up with the improvements in upstream inputs. Because MOD17 is one of the down-stream MODIS land products, the performance of the algorithm can be largely influenced by the uncertainties from upstream inputs, such as land cover, FPAR/LAI, the meteorological data, and algorithm itself. MODIS GPP fits well with GPP derived from 12 flux towers over North America. Globally, the 3-year MOD17 NPP is comparable to the Ecosystem Model–Data Intercomparison (EMDI) NPP data set, and global total MODIS GPP and NPP are inversely related to the observed atmospheric CO2 growth rates, and MEI index, indicating MOD17 are reliable products. From 2001 to 2003, mean global total GPP and NPP estimated by MODIS are 109.29 Pg C/year and 56.02 Pg C/year, respectively. Based on this research, the improved global MODIS primary production data set is now ready for monitoring ecological conditions, natural resources and environmental changes.
Sensitivity of Moderate Resolution Imaging Spectroradiometer (MODIS) terrestrial primary production to the accuracy of meteorological reanalyses
Zhao, M., S. W. Running, and R. R. Nemani
Journal of Geophysical Research. 111, G01002, doi:10.1029/2004JG000004. 2006
The Moderate Resolution Imaging Spectroradiometer (MODIS) on board NASA’s satellites, Terra and Aqua, dramatically improves our ability to accurately and continuously monitor the terrestrial biosphere. MODIS information is used to estimate global terrestrial primary production weekly and annually in near-real time at a 1-km resolution. MODIS terrestrial primary production requires daily gridded assimilation meteorological data as inputs, and the accuracy of the existing meteorological reanalysis data sets show marked differences both spatially and temporally. This study compares surface meteorological data sets from three well-documented global reanalyses, NASA Data Assimilation Office (DAO), European Centre for Medium-Range Weather Forecasts (ECMWF) (ERA-40) and National Centers for Environmental Prediction/National Center for Atmospheric Research (NCEP/NCAR) reanalysis 1, with observed weather station data and other gridded data interpolated from the observations, to evaluate the sensitivity of MODIS global terrestrial gross and net primary production (GPP and NPP) to the uncertainties of meteorological inputs both in the United States and the global vegetated areas. NCEP tends to overestimate surface solar radiation, and underestimate both temperature and vapor pressure deficit (VPD). ECMWF has the highest accuracy but its radiation is lower in tropical regions, and the accuracy of DAO lies between NCEP and ECMWF. Biases in temperature are mainly responsible for large VPD biases in reanalyses. MODIS NPP contains more uncertainties than GPP. Global total MODIS GPP and NPP driven by DAO, ECMWF, and NCEP show notable differences (>20 PgC/yr) with the highest estimates from NCEP and the lowest from ECMWF. Again, the DAO results lie somewhere between NCEP and ECMWF estimates. Spatially, the larger discrepancies among reanalyses and their derived MODIS GPP and NPP occur in the tropics. These results reveal that the biases in meteorological reanalyses can introduce substantial error into GPP and NPP estimations, and emphasize the need to minimize these biases to improve the quality of MODIS GPP and NPP products.
Evaluation of remote sensing based terrestrial productivity from MODIS using tower eddy flux network observations
Heinsch, F. A., M. Zhao, S. W. Running, J. S. Kimball, R. R. Nemani, K. J. Davis, et al.
IEEE Transactions on Geoscience and Remote Sensing, 44(7): 1908-1925. 2006
The Moderate Resolution Spectroradiometer (MODIS) sensor has provided near real-time estimates of gross primary production (GPP) since March 2000. We compare four years (2000 to 2003) of satellite-based calculations of GPP with tower eddy CO2 flux-based estimates across diverse land cover types and climate regimes. We examine the potential error contributions from meteorology, leaf area index (LAI)/fPAR, and land cover. The error between annual GPP computed from NASA’s Data Assimilation Office’s (DAO) and tower-based meteorology is 28%, indicating that NASA’s DAO global meteorology plays an important role in the accuracy of the GPP algorithm. Approximately 62% of MOD15-based estimates of LAI were within the estimates based on field optical measurements, although remaining values overestimated site values. Land cover presented the fewest errors, with most errors within the forest classes, reducing potential error. Tower-based and MODIS estimates of annual GPP compare favorably for most biomes, although MODIS GPP overestimates tower-based calculations by 20%–30%. Seasonally, summer estimates of MODIS GPP are closest to tower data, and spring estimates are the worst, most likely the result of the relatively rapid onset of leaf-out. The results of this study indicate, however, that the current MODIS GPP algorithm shows reasonable spatial patterns and temporal variability across a diverse range of biomes and climate regimes. So, while continued efforts are needed to isolate particular problems in specific biomes, we are optimistic about the general quality of these data, and continuation of the MOD17 GPP product will likely provide a key component of global terrestrial ecosystem analysis, providing continuous weekly measurements of global vegetation production.
Evaluating water stress controls on primary production in biogeochemical and remote sensing based models
Mu, Q., M. Zhao, F. A. Heinsch, M. Liu, H. Tian and S. W. Running
Journal of Geophysical Research, 112, G01012, doi: 10.1029/2006JG000179, 2007
Water stress is one of the most important limiting factors controlling terrestrial primary production, and the performance of a primary production model is largely determined by its capacity to capture environmental water stress. The algorithm that generates the global near real-time MODIS GPP/NPP products (MOD17) uses VPD (Vapor Pressure Deficit) alone to estimate the environmental water stress. This paper compares the water stress calculation in the MOD17 algorithm with results simulated using a process-based biogeochemical model (Biome-BGC) to evaluate the performance of the water stress determined using the MOD17 algorithm. The investigation study areas include China and the conterminous U.S. because of the availability of daily meteorological observation data. Our study shows that VPD alone can capture interannual variability of the full water stress nearly over all the study areas. In wet regions, where annual precipitation is greater than 400 mm/yr, the VPD–based water stress estimate in MOD17 is adequate to explain the magnitude and variability of water stress determined from atmospheric VPD and soil water in Biome-BGC. In some dry regions, where soil water is severely limiting, MOD17 underestimates water stress, overestimates GPP, and fails to capture the intra-annual variability of water stress. The MOD17 algorithm should add soil water stress to its calculations in these dry regions, thereby improving GPP estimates. Interannual variability in water stress is simpler to capture than the seasonality, but it is more difficult to capture this interannual variability in GPP. The MOD17 algorithm captures inter- and intra-annual variability of both the Biome-BGC-calculated water stress and GPP better in the conterminous USA than in the strongly monsoon-controlled China.
A continuous satellite-derived measure of global terrestrial primary production
Running, S., R. R. Nemani, F. A. Heinsch, M. Zhao, M. Reeves, and H. Hashimoto.
BioScience, 54(6): 547-560. 2004.
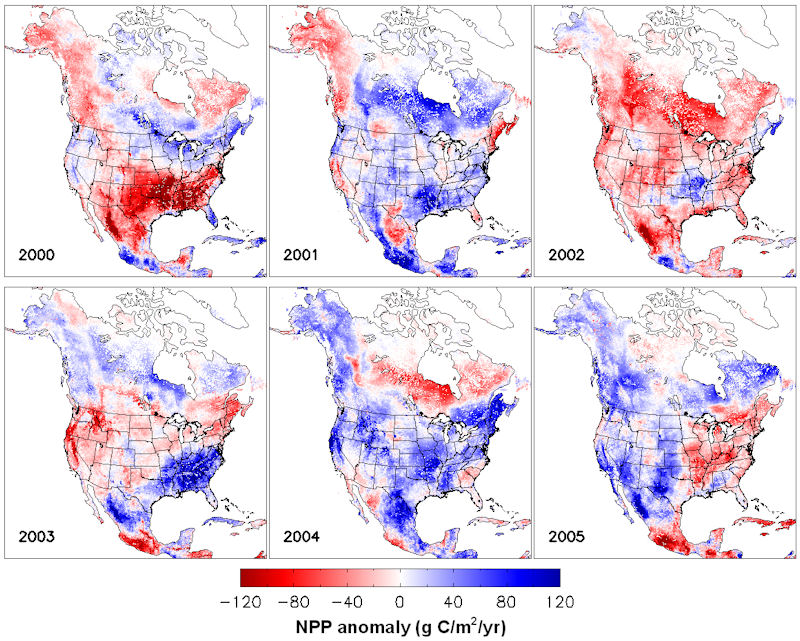
Until recently, continuous monitoring of global vegetation productivity has not been possible because of technological limitations. This article introduces a new satellite-driven monitor of the global biosphere that regularly computes daily gross primary production (GPP) and annual net primary production (NPP) at 1-kilometer (km) resolution over 109,782,756 km2 of vegetated land surface. We summarize the history of global NPP science, as well as the derivation of this calculation, and current data production activity. The first data on NPP from the EOS (Earth Observing System) MODIS (Moderate Resolution Imaging Spectroradiometer) sensor are presented with different types of validation. We offer examples of how this new type of data set can serve ecological science, land management, and environmental policy. To enhance the use of these data by nonspecialists, we are now producing monthly anomaly maps for GPP and annual NPP that compare the current value with an 18-year average value for each pixel, clearly identifying regions where vegetation growth is higher or lower than normal.
Climate-driven increases in global terrestrial net primary production from 1982 to 1999
Nemani, R. R., C. D. Keeling, H. Hashimoto, W. M. Jolly, S. C. Piper, C. J. Tucker, R. B. Myneni, and S. W. Running.
Science, 300: 1560-1563. 2003
Recent climatic changes have enhanced plant growth in northern mid-latitudes and high latitudes. However, a comprehensive analysis of the impact of global climatic changes on vegetation productivity has not before been expressed in the context of variable limiting factors to plant growth. We present a global investigation of vegetation responses to climatic changes by analyzing 18 years (1982 to 1999) of both climatic data and satellite observations of vegetation activity. Our results indicate that global changes in climate have eased several critical climatic constraints to plant growth, such that net primary production increased 6% (3.4 petagrams of carbon over 18 years) globally. The largest increase was in tropical ecosystems. Amazon rain forests accounted for 42% of the global increase in net primary production, owing mainly to decreased cloud cover and the resulting increase in solar radiation.