
Global Surface Water Index
Project Summary
Example Images
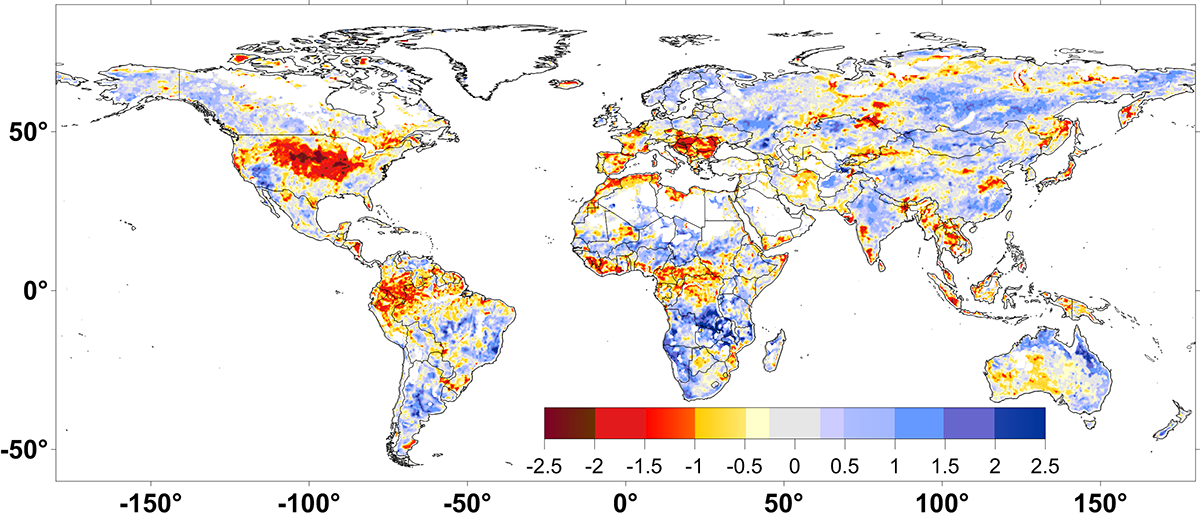
Global SWI map showing drought and pluvial patterns of August 2012
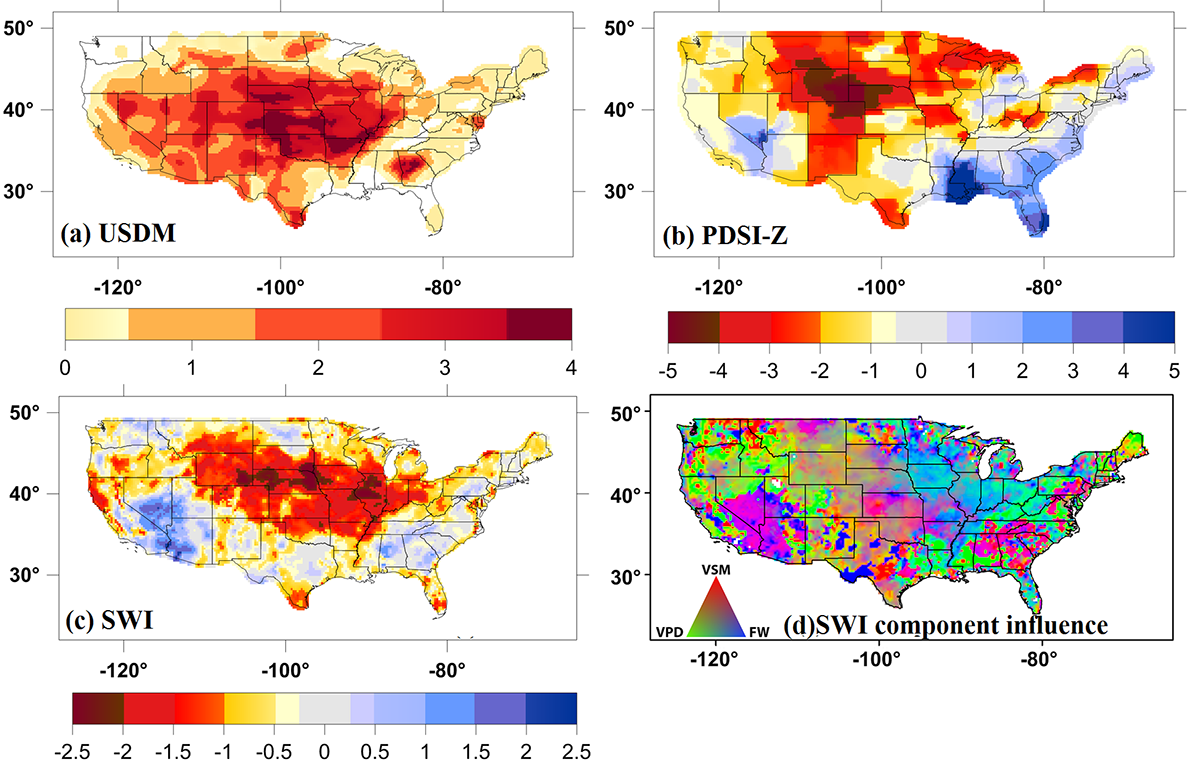
Drought severity maps for August 2012 assessed by USDM (a), PDSI-Z (b), SWI (c), and the SWI component influence map (d)
Selected Publications
Du, J., J.S. Kimball, J. Sheffield, I. Velicogna, M. Zhao, M. Pan, C. Fisher, H.E. Beck, J.D. Watts, G. A., and E.F. Wood, 2021. Synergistic satellite assessment of global vegetation health in relation to ENSO-induced droughts and pluvials. JGR Biogeosciences, 126, 5, e2020JG006006, https://doi.org/10.1029/2020JG006006.
Du, J., J.S. Kimball, I. Velicogna, M. Zhao, L.A. Jones, J.D. Watts, Y. Kim, and G. A, 2019. Multi-component satellite assessment of drought severity in the contiguous United States from 2002 to 2017 using AMSR-E and AMSR2. Water Resources Research, 55, DOI: 10.1029/2018WR024633.
Key Datasets
Weekly global SWI dataset:
http://files.ntsg.umt.edu/data/LPDR_v2/GeoTIFF/ASWI_NRT_Weekly/2021/
Weekly SWI monitor for USA domain:
https://jinyangdu.users.earthengine.app/view/swidroughtmonitor
NTSG Personnel
Jinyang Du
John Kimball